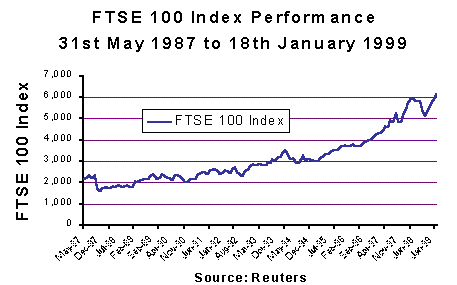
Performance of FTSE
100 Index since 1987

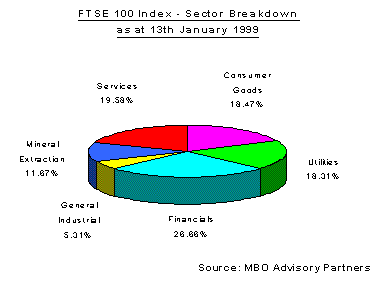
Sector Breakdown of the FTSE 100 Index

Comparison of Major UK Stockmarket Indices
MAJOR INDEX PERFORMANCES |
| |
% growth
1 month |
% growth
3 months |
% growth
6 months |
% growth
12 months |
% growth
15 months |
FTSE 100 |
2.18% |
6.69% |
-0.70% |
10.86% |
16.35% |
FTSE 350 Share |
1.30% |
5.07% |
-4.77% |
6.59% |
11.02% |
FTSE All Share Index |
1.11% |
4.91% |
-5.07% |
8.06% |
12.82% |
FTSE Mid 250 |
-3.02% |
-1.45% |
-17.78% |
-1.42% |
1.01% |
FTSE SmallCap |
-2.76% |
-3.90% |
-25.79% |
-12.56% |
-11.76% |
| |
|
|
|
|
|
Bid to bid price gross income reinvested - all periods to 16th
December 1998 |
|
|
|
Source: Reuters Hindsight |
|
|
|
|
|
Leaders and Laggards in the FTSE 100 Index
for the period 16th April 1997 to 13th January 1999
BEST BY SECTOR |
|
performance |
% of index |
Glaxo Wellcome |
Consumer Goods |
14.64% |
6.843 |
Standard Chartered |
Financials |
17.91% |
0.682 |
British Aerospace |
General Industrial |
4.08% |
0.735 |
British Petroleum |
Mineral Extraction |
3.31% |
7.609 |
Kingfisher |
Services |
29.98% |
0.73 |
Orange |
Utilities |
36.40% |
0.953 |
WORST BY SECTOR |
|
performance |
% of index |
Reckitt & Colman |
Consumer Goods |
-36.15% |
0.282 |
Schroders Non Voting Ord |
Financials |
-35.31% |
0.053 |
ICI |
General Industrial |
-48.42% |
0.316 |
Shell Transport & Trading |
Mineral Extraction |
-18.08% |
2.94 |
United News & Media |
Services |
-44.08% |
0.212 |
United Utilities |
Utilities |
-16.18% |
0.212 |
Period: 16th April 1997 to 13th
January 1999
Source: MBO Advisory Partners |