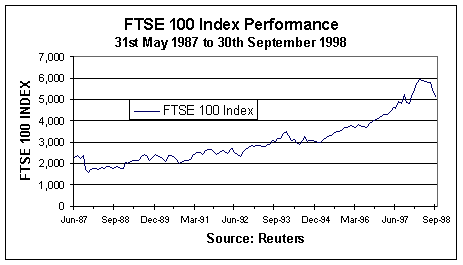
Performance of FTSE 100
Index since 1987

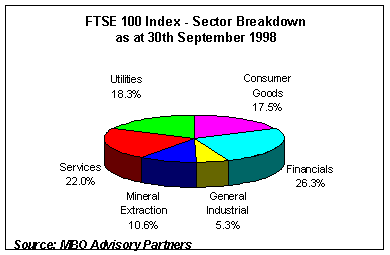
Sector Breakdown of the FTSE 100 Index

Comparison of Major UK Stockmarket Indices
MAJOR INDEX PERFORMANCES |
| |
% growth
1 month |
% growth
3 months |
% growth
6 months |
% growth
12 months |
FTSE 100 |
-3.33% |
-12.49% |
-13.51% |
-0.96% |
FTSE 350 Share |
-3.79% |
-13.94% |
-15.16% |
-3.83% |
FTSE All Share Index |
-3.70% |
-13.87% |
-14.55% |
-2.00% |
FTSE Mid 250 |
-5.06% |
-17.44% |
-17.76% |
-5.92% |
FTSE SmallCap |
-6.56% |
-23.78% |
-24.45% |
-14.92% |
| |
|
|
|
|
Bid to bid price gross income reinvested - all periods to 30th
September 1998 |
|
|
Source: Reuters Hindsight |
|
|
|
|
Leaders and Laggards in the FTSE 100 Index
since 16th June 1998
BEST BY SECTOR |
|
performance |
% of Index |
Associated British
Foods |
Consumer Goods |
6.72% |
0.567 |
Alliance &
Leicester |
Financials |
12.95% |
0..531 |
GEC |
General Industrial |
-11.03% |
1.241 |
Rio Tinto (regd) |
Mineral Extraction |
2.76% |
0.791 |
Railtrack |
Services |
29.97% |
0.862 |
BG |
Utilities |
22.50% |
1.608 |
| |
|
|
|
WORST BY SECTOR |
|
performance |
% of Index |
Reckitt & Colman |
Consumer Goods |
-26.36% |
0.369 |
Amvescap |
Financials |
-44.18% |
0.251 |
ICI |
General Industrial |
-54.58% |
0.369 |
Shell Transport
& Trading |
Mineral Extraction |
-15.19% |
3.801 |
Kingfisher |
Services |
-46.57% |
0.772 |
Cable & Wireless |
Utilities |
-13.21% |
1.402 |
Source: MBO
Advisory Partners as at 30th September 1998 |
|
|
|