| Performance
since netPEP was launched. netPEP Performance
Statistics
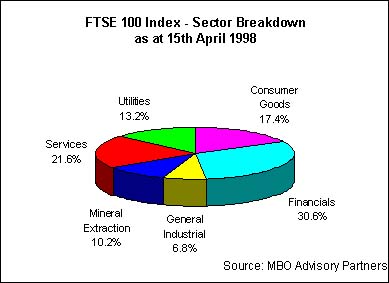
FTSE
100 Index Statistics
| MAJOR INDEX PERFORMANCES |
| |
% growth
1 month |
% growth
3 months |
% growth
6 months |
% growth
12 months |
| FTSE 100 |
5.57% |
21.08% |
16.58% |
46.84% |
| FTSE 350
Share |
5.17% |
19.11% |
14.69% |
38.60% |
| FTSE All
Share Index |
5.04% |
19.62% |
15.82% |
40.60% |
| FTSE Mid 250 |
3.44% |
15.06% |
12.64% |
22.23% |
| FTSE SmallCap
|
3.19% |
12.66% |
10.45% |
14.75% |
Bid to bid
price gross income reinvested - all
periods to 15th April 1998
Source: Reuters Hindsight |
LEADERS AND LAGGARDS
| BEST BY SECTOR |
Sector |
performance |
% of Index |
| SmithKline Beecham |
Consumer Goods |
69.2% |
3.85% |
| Bank of Scotland |
Financials |
145.2% |
0.85% |
| GKN |
General Industrial |
68.4% |
0.51% |
| Shell Transport &
Trading |
Mineral Extraction |
29.5% |
3.94% |
| Hays |
Services |
110.9% |
0.41% |
| Vodaphone |
Utilities |
135.6% |
0.17% |
| |
| WORST BY SECTOR |
Sector |
performance |
% of Index |
| BAT Industries |
Consumer Goods |
2.6% |
1.54% |
| 3i Group |
Financials |
19.8% |
0.31% |
| Blue Circle |
General Industrial |
-12.3% |
0.27% |
| Rio Tinto Regd |
Mineral Extraction |
-16.7% |
0.78% |
| BSkyB |
Services |
-26.3% |
0.67% |
| National Power |
Utilities |
4.53% |
0.63% |
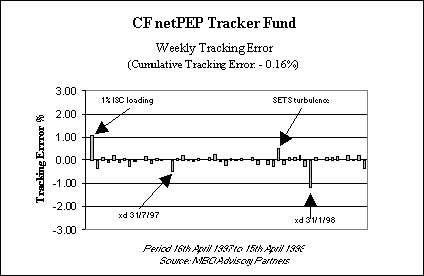
Period: 16th
April 1997 to 15th April 1998
Source: MBO Advisory Partners |
|