 |
| Volume 1, Issue 6 |
6th February
1998 |
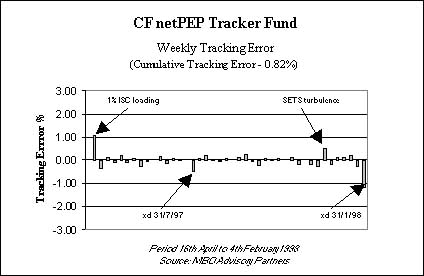
| Performance
since netPEP was launched.


| MAJOR INDEX
PERFORMANCES |
% growth
1 month |
% growth
3 months |
% growth
6 months |
% growth
12 months |
| FTSE 100 |
5.06% |
2.71% |
24.72% |
28.34% |
| FTSE 350 Share |
4.60% |
1.57% |
19.41% |
20.75% |
| FTSE All Share
Index |
4.51% |
1.69% |
20.11% |
22.65% |
| FTSE Mid 250 |
2.64% |
-1.85% |
6.66% |
5.21% |
| FTSE SmallCap |
3.13% |
-1.71% |
2.94% |
3.44% |
| Bid to
bid price gross income reinvested - all
periods to 21st January 1998
Source: Reuters Hindsight |
LEADERS AND LAGGARDS
| BEST
BY SECTOR |
|
performance |
%
of Index |
| Zeneca
Group |
Consumer
Goods |
15.66% |
2.42 |
| Sun
Life & Provincial |
Financials |
19.54% |
0.47 |
| Tomkins |
General
Industrial |
10.58% |
0.36 |
| RTZ |
Mineral
Extraction |
5.68% |
0.84 |
| Rentokill
Initial |
Services |
15.02% |
0.91 |
| Centrica |
Utilities |
16.11% |
0.46 |
| |
|
|
|
| WORST
BY SECTOR |
|
performance |
%
of Index |
| Unilever |
Consumer
Goods |
-4.38% |
1.68 |
| Standard
Chartered |
Financials |
-17.22% |
0.47 |
| Rolls
Royce |
General
Industrial |
-16.91% |
0.28 |
| Shell
Transport |
Mineral
Extraction |
-11.15% |
4.35 |
| Dixons |
Services |
-20.15% |
0.22 |
| Cable
& Wireless |
Utilities |
-5.40% |
1.18 |
| Period:
19th December 1997 to 21st January 1998
Source: MBO Advisory Partners |
|
| |
|