| Performance
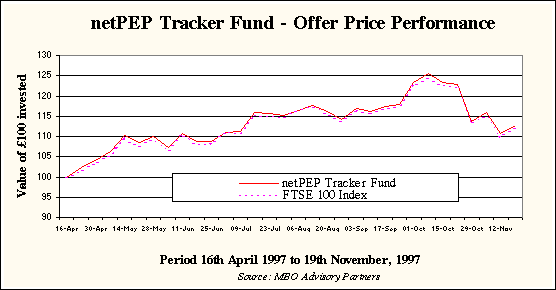
since netPEP was launched. It is now
seven months since we launched netPEP. During
this time the offer price of units has risen by
12.69% against the Index which is up 12.18%,
illustrating that netPEP is keeping closely in
touch with the Index despite the volatility of
the market, helped by the fact that we deal at
weekly intervals. If we dealt more frequently,
there is a risk that the tracking error might
increase.

As far as the Index constituents are
concerned, the worst performer over the seven
month period was BSkyB (down 30%) with eight
other companies recording double digit falls.
Under-performance of the market on this scale was
exceptional since 50 companies managed to beat
the Index over the period. The best performer was
Bank of Scotland (up 58%) with the less glamorous
gas distributor, Centrica coming second with a
rise of 51% and Sainsbury’s in third place
up 49%.
MAJOR INDEX
PERFORMANCES
| |
% growth 1 month |
% growth 3 months |
% growth 6 months |
% growth 12 months |
| FTSE 100 |
-7.31% |
-2.32% |
13.91% |
25.17% |
| FTSE 350 Share |
-6.99% |
-2.32% |
10.37% |
18.30% |
| FTSE All Share Index |
-6.87% |
-1.76% |
10.94% |
20.45% |
| FTSE Mid 250 |
-5.67% |
-1.22% |
2.34% |
5.23% |
| FTSE SmallCap |
-5.10% |
1.10% |
-0.92% |
5.36% |
Bid to bid
price gross income reinvested - all periods to
19th November 1997
Source: Reuters Hindsight
| BEST
BY SECTOR |
performance |
% of sector |
| Associated British Foods |
Consumer Goods |
3.38% |
0.487 |
| Norwich Union |
Financials |
2.12% |
0.771 |
| GEC |
General Industrial |
-0.87% |
1.197 |
| LASMO |
Mineral Extraction |
-3.55% |
0.259 |
| Sainsbury (J) |
Services |
5.41% |
1.024 |
| British Telecom |
Utilities |
2.70% |
3.239 |
| |
| WORST
BY SECTOR |
performance |
% of sector |
| Zeneca Group |
Consumer Goods |
-16.88% |
1.907 |
| HSBC Hldgs |
Financials |
-26.36% |
4.124 |
| TI Group |
General Industrial |
-28.68% |
0.23 |
| Rio Tinto Regd |
Mineral Extraction |
-26.17% |
0.85 |
| BAA |
Services |
-17.57% |
0.573 |
| Cable & Wireless |
Utilities |
-7.86% |
1.315 |
Period: 15th
October 1997 to 19th November 1997
Source: MBO Advisory Partners

|