| Performance
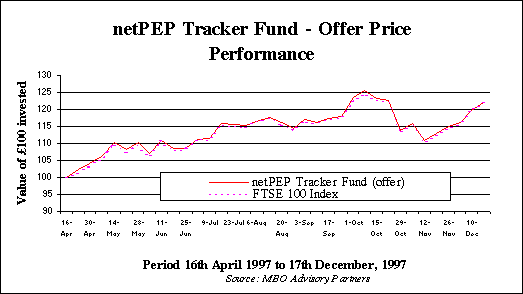
                since netPEP was launched. It is now
                eight months since we launched netPEP. During
                this time the offer price of units has risen by
                21% against the Index which is up almost exactly
                the same, illustrating that netPEP is keeping
                closely in touch with the Index despite the
                volatility of the market, helped by the fact that
                we deal at weekly intervals. If we dealt more
                frequently, there is a risk that the tracking
                error might increase.  
                  
                The performance of the FTSE 100
                Index surprised everyone. The doom and gloomsters
                were pointing in November to the awesome impact
                that the slump in the Asian economies was going
                to have on the western markets, now at around the
                top of the current stockmarket cycle. As it is
                the Index recorded a massive 8.85% gain leaving
                the index on 17th December less than
                3% below its 52 week high of 5367.3 and 31% above
                its 52 week low.  
                Once again it was the
                Financials which topped the leaders board with
                average sector gains of 13% with the biggest
                gains coming from Alliance & Leicester which
                will please the carpetbaggers (+22%) and NatWest,
                a previous laggard of the financials in recent
                months with a gain of 21% on bid speculation.
                Even the Asian affected banks managed to show
                gains with Standard Chartered rising 9% and large
                FTSE constituent HSBC rising 14%.  
                
                    
                        |   | 
                        % growth 1 month | 
                        % growth 3 months  | 
                        % growth 6 months | 
                        % growth 12 months | 
                     
                    
                        | FTSE 100 | 
                        6.65% | 
                        3.77% | 
                        22.59% | 
                        32.58% | 
                     
                    
                        | FTSE 350 Share | 
                        5.91% | 
                        3.15% | 
                        17.59% | 
                        24.78% | 
                     
                    
                        | FTSE All Share Index | 
                        5.55% | 
                        3.24% | 
                        17.96% | 
                        26.69% | 
                     
                    
                        | FTSE Mid 250  | 
                        2.82% | 
                        1.48% | 
                        5.12% | 
                        8.58% | 
                     
                    
                        | FTSE SmallCap  | 
                        54.00% | 
                        66.00% | 
                        16.00% | 
                        7.47% | 
                     
                    
                        | Bid to bid price gross income
                        reinvested - all periods to 17th December
                        1997 Source: Reuters Hindsight | 
                     
                 
                Other sectors did not perform
                so well although both the Consumer Goods and
                Utilities sectors managed useful average gains
                over the month of 11% and 9% respectively but
                bringing up the rear was Mineral Extractions
                sector (mainly comprising oil companies) which
                only just managed to keep its head above the
                water with a gain of 0.1%.  
                There were some exceptional
                individual performances amongst the
                pharmaceuticals with Glaxo Wellcome and
                SmithKline rising sharply on healthy forecasts
                with rises of nearly 20% but the star performer
                by a long margin was from the alcoholics drinks
                sector not in anticipation of big Christmas
                profits but bid speculation for Allied Domecq
                which shot nearly 60%.  
                MAJOR INDEX
                PERFORMANCES 
                
                    
                        | BEST
                        BY SECTOR | 
                          | 
                        performance | 
                        %
                        of Index | 
                     
                    
                        | Zeneca Group | 
                        Consumer Goods | 
                        19.26% | 
                        2.005 | 
                     
                    
                        | Alliance & Leicester | 
                        Financials | 
                        21.75% | 
                        0.427 | 
                     
                    
                        | ICI | 
                        General Industrial | 
                        11.19% | 
                        0.685 | 
                     
                    
                        | Shell Transport &
                        Trading | 
                        Mineral Extraction | 
                        11.16% | 
                        4.573 | 
                     
                    
                        | Allied Domecq | 
                        Services | 
                        59.81% | 
                        0.567 | 
                     
                    
                        | Vodaphone | 
                        Utilities | 
                        23.19% | 
                        1.327 | 
                     
                    
                        |   | 
                          | 
                          | 
                          | 
                     
                    
                        | WORST
                        BY SECTOR | 
                          | 
                        performance | 
                        %
                        of Index | 
                     
                    
                        | Associated British Foods | 
                        Consumer Goods | 
                        -0.91% | 
                        0.425 | 
                     
                    
                        | Land Securities | 
                        Financials | 
                        2.96% | 
                        0.549 | 
                     
                    
                        | BOC | 
                        General Industrial | 
                        -1.13% | 
                        0.472 | 
                     
                    
                        | Billiton | 
                        Mineral Extraction | 
                        -10.03% | 
                        0.336 | 
                     
                    
                        | Dixons | 
                        Services | 
                        -10.40% | 
                        0.224 | 
                     
                    
                        | National Grid | 
                        Utilities | 
                        0.17% | 
                        0.503 | 
                     
                    
                        | Period: 17th
                        November 1997 to 19th December 1997Source:
                        MBO Advisory Partners  | 
                     
                 
                 |